Our expanding educational series recently introduced you to two additional technical indicators in crypto: Exponential Moving Average and Moving Average Convergence Divergence. Today we'll apply those same indicators to complete a high level technical analysis on Bitcoin's current price.
After BTC’s recent rejection at the $5,500 resistance, the 50-EMA in the 4h chart held successfully as support - until it broke yesterday. Now, it acts as resistance and in order for BTC to stay bullish, we should look for movement above the $5,100 mark.
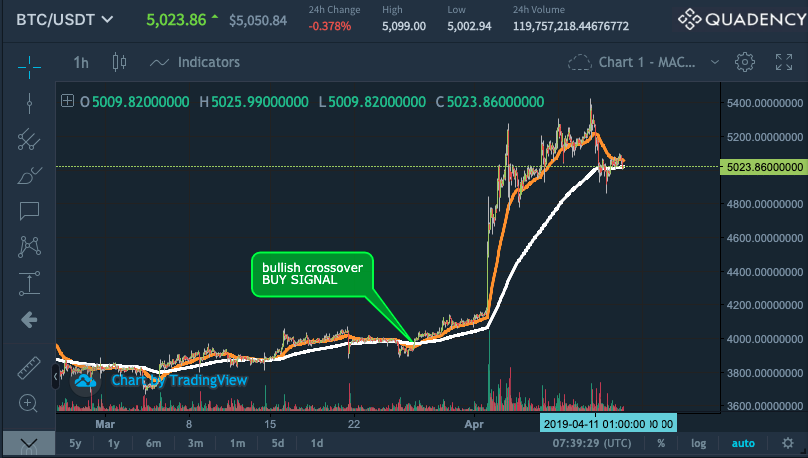
When looking at recent movement, we can see in the 1h chart below that the 50-EMA (orange line) crossed above the 200-EMA (white line), a very bullish indicator. In fact, Bitcoin has surged 36% since then.
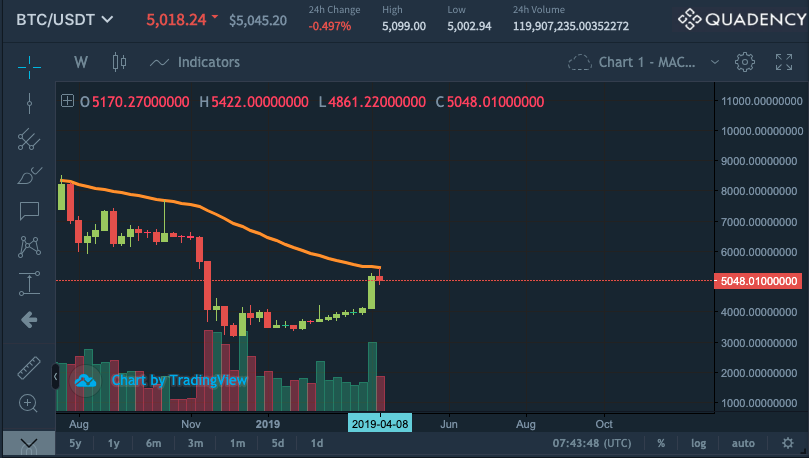
But remember EMAs can act as either support or resistance so it’s also important to consider different time frames. In the example below, the 50-EMA in the longer term weekly chart acted as strong resistance and Bitcoin has continued to be rejected at this level so far.
When looking at the recent 1h BTC chart, we can see that the MACD lines crossed multiple times. The red line moving above the blue line is considered a bearish sell signal, while the blue line crossing above the red line, is considered a bullish buy signal. The recent price drop yesterday actually caused a bearish crossover in the daily MACD, however the blue line bounced nicely in the hours following indicating a strong support.
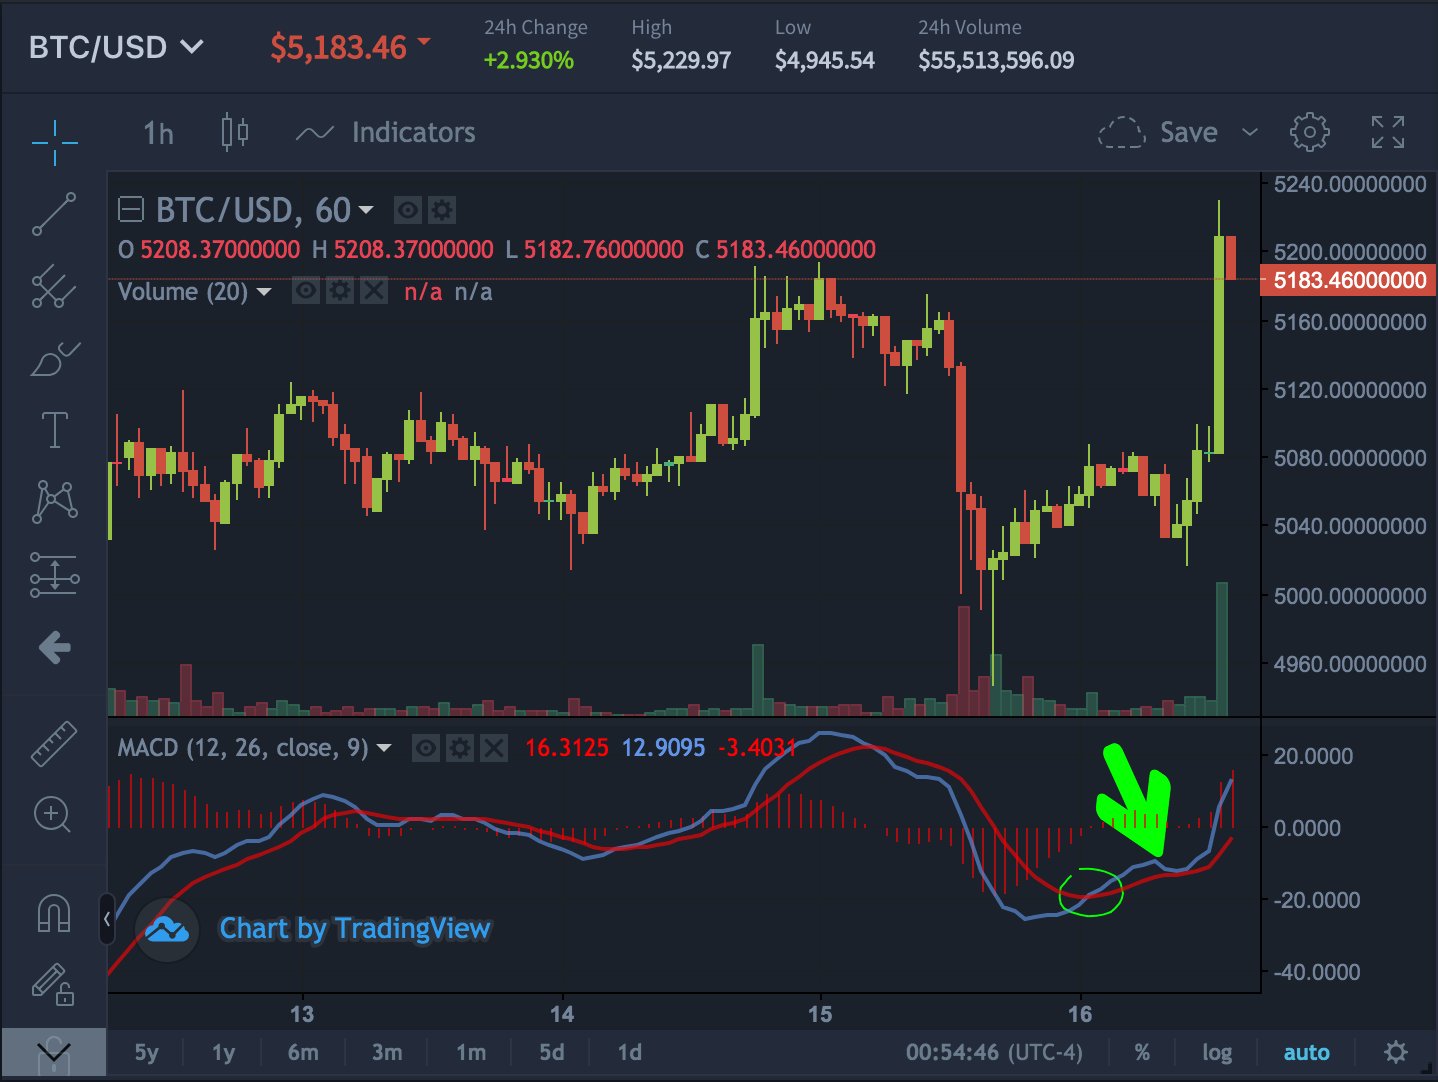
Also note that if the bullish crossover happens in the lower half of the MACD, it is thought to create a stronger buy signal. The same holds true for the bearish crossover. If it happens in the upper half of the MACD, it’s a stronger sell signal.
In fact, selling when the first sell signal in the example above appears would have protected you from the following 8% decline. And purchasing when the buy signal was indicated would have led to a 5% return.
We hope this article helps you leverage the EMA and MACD indicators to spot potential buy or sell opportunities. It's also important to note that indicators, although widely used in TA are inherently "lagging" indicators, in that the lines often cross and uncross for several times before settling to their final values. Therfore, it's often wise to wait a few bars to confirm the signal.
Hone your TA skills with Quadency's first-class TradingView integration, draw your custom charts, and save them for easy access in the future!
--
After BTC’s recent rejection at the $5,500 resistance, the 50-EMA in the 4h chart held successfully as support - until it broke yesterday. Now, it acts as resistance and in order for BTC to stay bullish, we should look for movement above the $5,100 mark.
When looking at recent movement, we can see in the 1h chart below that the 50-EMA (orange line) crossed above the 200-EMA (white line), a very bullish indicator. In fact, Bitcoin has surged 36% since then.
But remember EMAs can act as either support or resistance so it’s also important to consider different time frames. In the example below, the 50-EMA in the longer term weekly chart acted as strong resistance and Bitcoin has continued to be rejected at this level so far.
When looking at the recent 1h BTC chart, we can see that the MACD lines crossed multiple times. The red line moving above the blue line is considered a bearish sell signal, while the blue line crossing above the red line, is considered a bullish buy signal. The recent price drop yesterday actually caused a bearish crossover in the daily MACD, however the blue line bounced nicely in the hours following indicating a strong support.
Also note that if the bullish crossover happens in the lower half of the MACD, it is thought to create a stronger buy signal. The same holds true for the bearish crossover. If it happens in the upper half of the MACD, it’s a stronger sell signal.
In fact, selling when the first sell signal in the example above appears would have protected you from the following 8% decline. And purchasing when the buy signal was indicated would have led to a 5% return.
We hope this article helps you leverage the EMA and MACD indicators to spot potential buy or sell opportunities. It's also important to note that indicators, although widely used in TA are inherently "lagging" indicators, in that the lines often cross and uncross for several times before settling to their final values. Therfore, it's often wise to wait a few bars to confirm the signal.
Hone your TA skills with Quadency's first-class TradingView integration, draw your custom charts, and save them for easy access in the future!
--
Be sure to join us on Telegram, Discord and Twitter!
Quad Terminal simplifies crypto portfolio management by unifying digital asset exchanges into a seamless, all-in-one platform. Traders and investors of all skill levels can access automated bot strategies and a comprehensive 360° portfolio view. Create your free account here!
Disclaimer: The content of this article is for general market education and commentary and is not intended to serve as financial, investment, or any other type of advice.

Manage all your crypto assets on the go with zero-gas swaps and a unified portfolio at your fingertips.


Disclaimer: Information contained herein should not be construed as investment advice, or investment recommendation, or an order of, or solicitation for, any transactions in financial instruments; We make no warranty or representation, whether express or implied, as to the completeness or accuracy of the information contained herein or fitness thereof for a particular purpose. Use of images and symbols is made for illustrative purposes only and does not constitute a recommendation to buy, sell or hold a particular financial instrument; Use of brand logos does not necessarily imply a contractual relationship between us and the entities owning the logos, nor does it represent an endorsement of any such entity by Quad Terminal, or vice versa. Market information is made available to you only as a service, and we do not endorse or approve it.
Copyright © Quad Terminal