While Quadency allows you to trade on different exchanges using a single interface with advanced charts, being able to analyze those charts is an important part of informed decision making.
Technical analysis, or TA, is based on the assumption that the necessary information about a market is contained in past price movements. TA cannot predict the future but it can be used to assign probabilities to potential price movements and their amplitudes. In technical analysis, a number of different indicators are used to assess those probabilities. We'll review several of them in this ongoing TA series, starting with some of the most common:
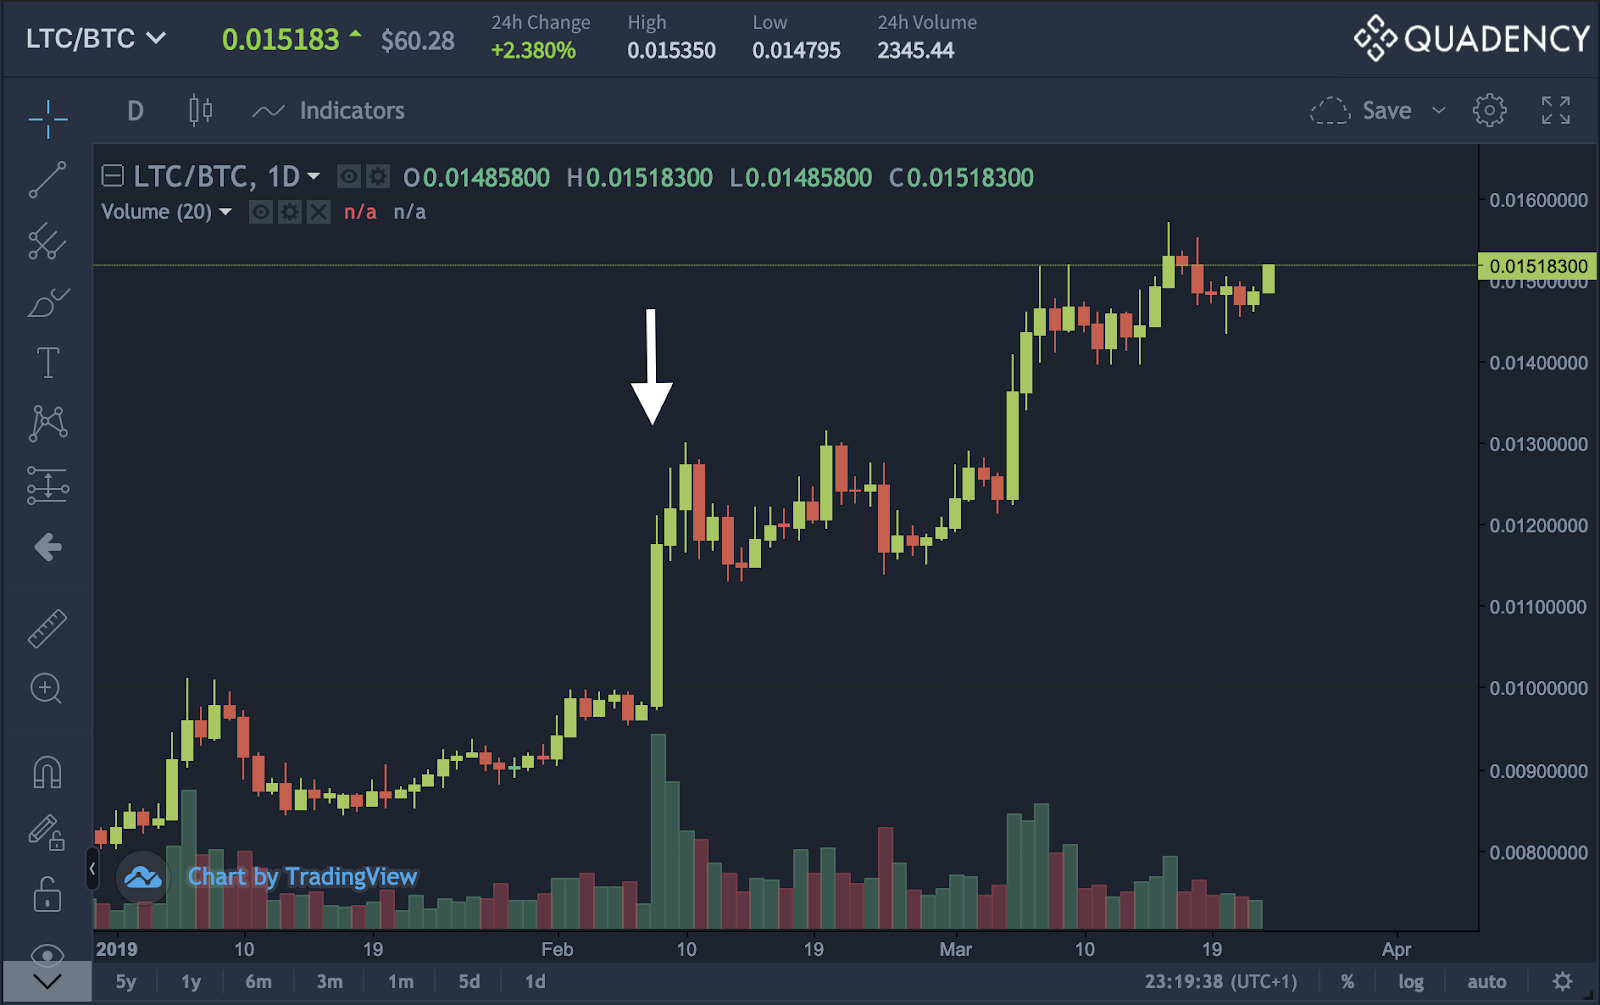
Alongside price, trading volume is another important metric of market conditions. The volume shows the amount of the asset that has changed ownership hands within a given period of time. Most chart layouts show the volume by default, as shown by the histogram along the bottom of your Quadency charts.
Large price changes, such as the one on February 8th in the example below, are usually accompanied by higher trading volume. A steady decrease in trading volume can indicate the end of an up or down trend.
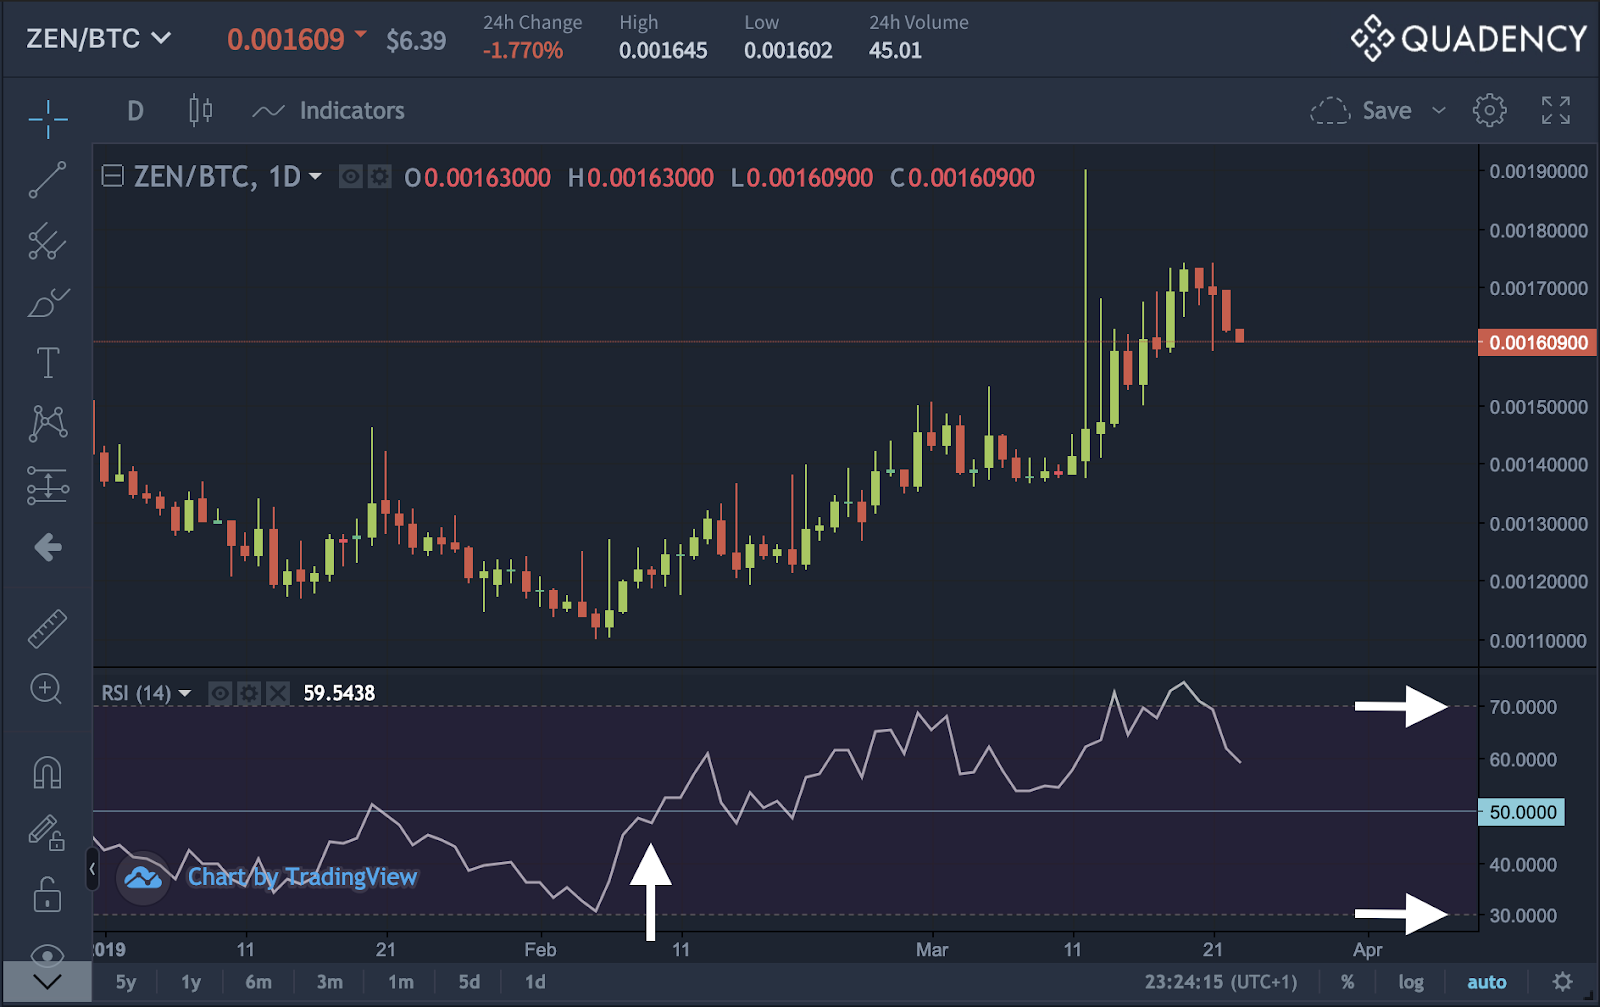
The Relative Strength Index is one of the most widely used crypto indicators. It is an oscillator, meaning it moves in a bounded range. The RSI carries information about the speed and change of price movements and can have values between 0 and 100. There are generally 3 key ranges to consider in the RSI values.
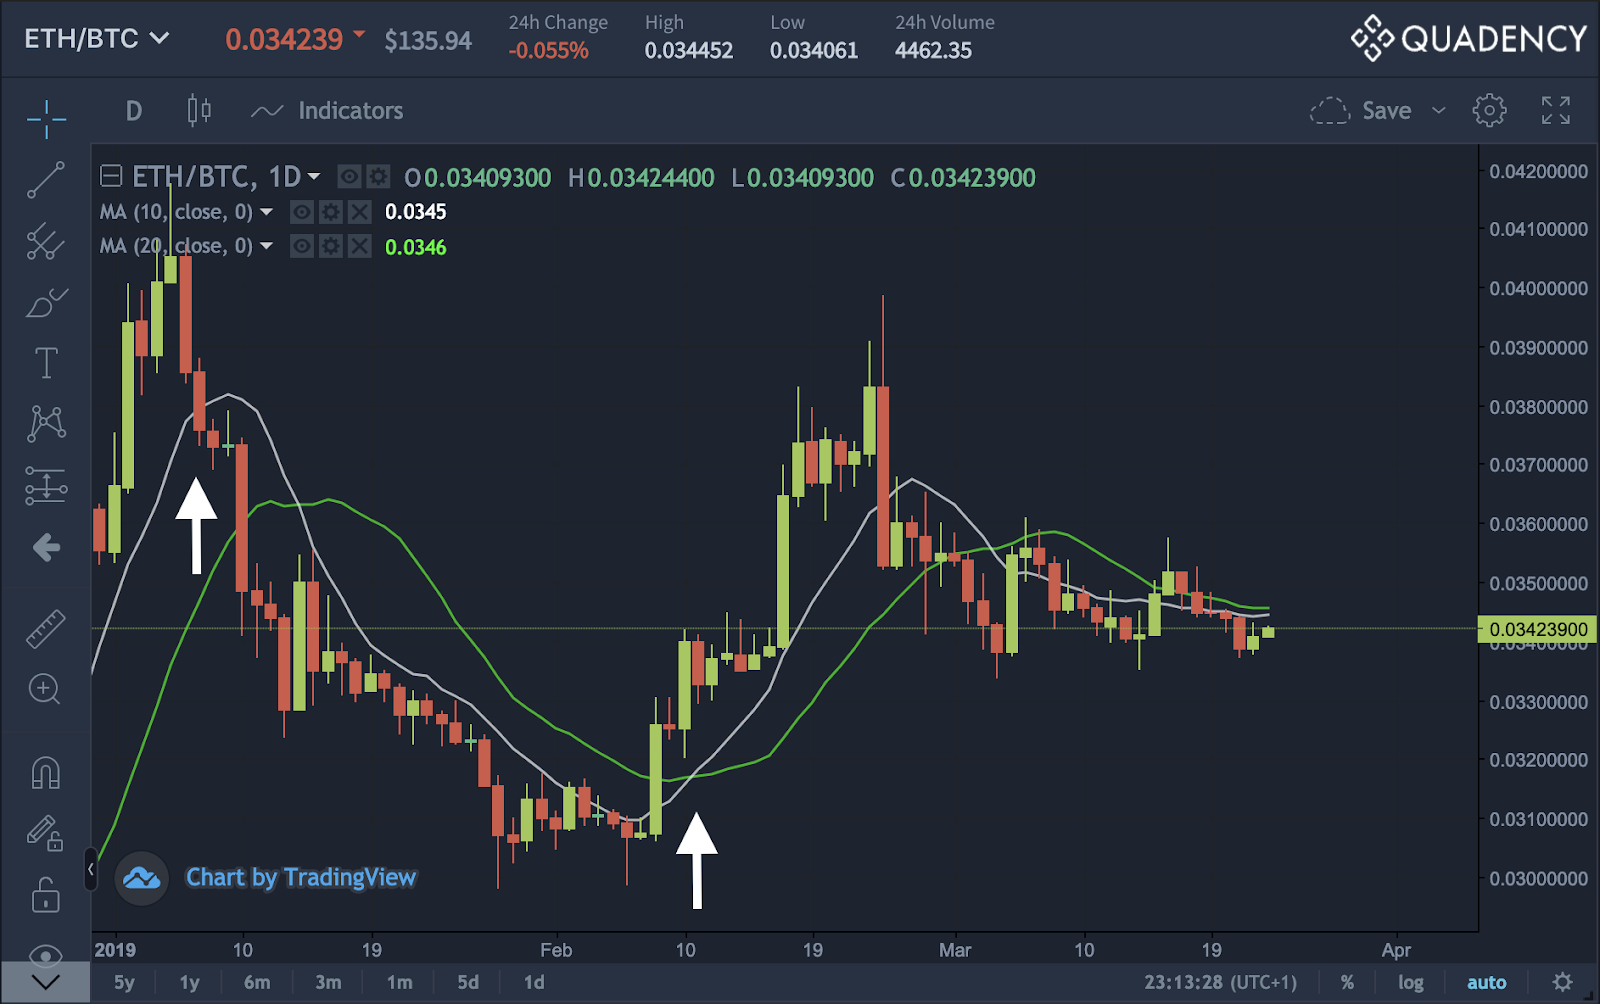
Another commonly used indicator used for crypto trading is the moving average. Moving averages can be calculated in a number of ways, with timespan being the key parameter. For example, to find the moving average for a 10-day period, you would take the average price of the last 10 days including today, and use the resulting value as today's 10-day MA value.
The bigger the timespan, the smoother the MA line will be. In the example below the 10-day moving average is shown in white and the 20-day moving average is shown in green. There are two main ways to use moving averages. One can look for the price crossing the MA (e.g. 3rd of January below) or for a cross in two MAs for different timespans (e.g. 10th of February).
Technical analysis is an important tool for informed decision making when trading digital assets. There are a number of indicators one can use to assign probabilities to potential price movements. In this article, we introduced you to three of the most commonly used indicators: volume, the relative strength index (RSI) and moving averages (MA).
Quadency's first-class TradingView integration allows you to apply a large number of indicators to create and save your advanced charts. So check out our follow-up article on more advanced indicators!
Technical analysis, or TA, is based on the assumption that the necessary information about a market is contained in past price movements. TA cannot predict the future but it can be used to assign probabilities to potential price movements and their amplitudes. In technical analysis, a number of different indicators are used to assess those probabilities. We'll review several of them in this ongoing TA series, starting with some of the most common:
Alongside price, trading volume is another important metric of market conditions. The volume shows the amount of the asset that has changed ownership hands within a given period of time. Most chart layouts show the volume by default, as shown by the histogram along the bottom of your Quadency charts.
Large price changes, such as the one on February 8th in the example below, are usually accompanied by higher trading volume. A steady decrease in trading volume can indicate the end of an up or down trend.
The Relative Strength Index is one of the most widely used crypto indicators. It is an oscillator, meaning it moves in a bounded range. The RSI carries information about the speed and change of price movements and can have values between 0 and 100. There are generally 3 key ranges to consider in the RSI values.
Another commonly used indicator used for crypto trading is the moving average. Moving averages can be calculated in a number of ways, with timespan being the key parameter. For example, to find the moving average for a 10-day period, you would take the average price of the last 10 days including today, and use the resulting value as today's 10-day MA value.
The bigger the timespan, the smoother the MA line will be. In the example below the 10-day moving average is shown in white and the 20-day moving average is shown in green. There are two main ways to use moving averages. One can look for the price crossing the MA (e.g. 3rd of January below) or for a cross in two MAs for different timespans (e.g. 10th of February).
Technical analysis is an important tool for informed decision making when trading digital assets. There are a number of indicators one can use to assign probabilities to potential price movements. In this article, we introduced you to three of the most commonly used indicators: volume, the relative strength index (RSI) and moving averages (MA).
Quadency's first-class TradingView integration allows you to apply a large number of indicators to create and save your advanced charts. So check out our follow-up article on more advanced indicators!
Be sure to join us on Telegram, Discord and Twitter!
Quad Terminal simplifies crypto portfolio management by unifying digital asset exchanges into a seamless, all-in-one platform. Traders and investors of all skill levels can access automated bot strategies and a comprehensive 360° portfolio view. Create your free account here!
Disclaimer: The content of this article is for general market education and commentary and is not intended to serve as financial, investment, or any other type of advice.

Manage all your crypto assets on the go with zero-gas swaps and a unified portfolio at your fingertips.


Disclaimer: Information contained herein should not be construed as investment advice, or investment recommendation, or an order of, or solicitation for, any transactions in financial instruments; We make no warranty or representation, whether express or implied, as to the completeness or accuracy of the information contained herein or fitness thereof for a particular purpose. Use of images and symbols is made for illustrative purposes only and does not constitute a recommendation to buy, sell or hold a particular financial instrument; Use of brand logos does not necessarily imply a contractual relationship between us and the entities owning the logos, nor does it represent an endorsement of any such entity by Quad Terminal, or vice versa. Market information is made available to you only as a service, and we do not endorse or approve it.
Copyright © Quad Terminal